

The average of daily percentages is not a period rating
A rating is a fraction, and its denominator changes every day. Sum the percentages, divide by the day count, and you have quietly assumed all those days were the same size.
A period rating is the share of a target audience reached across several days: sum the viewers, sum the universes, then divide. The reflex version — add up the daily ratings, divide by the number of days — lands close enough on a broad target. On a narrow one it misses, and it misses in the same direction every time. That is the arithmetic doing what arithmetic does, not a slip by whoever built the sheet.
Why can't you average percentages?
A rating is a fraction: viewers on top, target universe underneath. The denominator changes every day. For a narrow target — women 25–34 in cities, say — the universe drifts daily as the panel breathes, the respondent mix shifts, weights get recalculated. That is a measurement system working normally.
Average the percentages and you have made a silent assumption: that every day carries the same audience size. Each day gets equal weight no matter how many people stand behind it. On a broad target the universe is large and steady, daily swings disappear into it, and the assumption roughly holds. Narrow the target and the universe shrinks, the same swings loom large in percentage terms, and it breaks. The stronger the correlation between a day's rating and that day's universe, the bigger the distortion.
Two days that show the whole problem
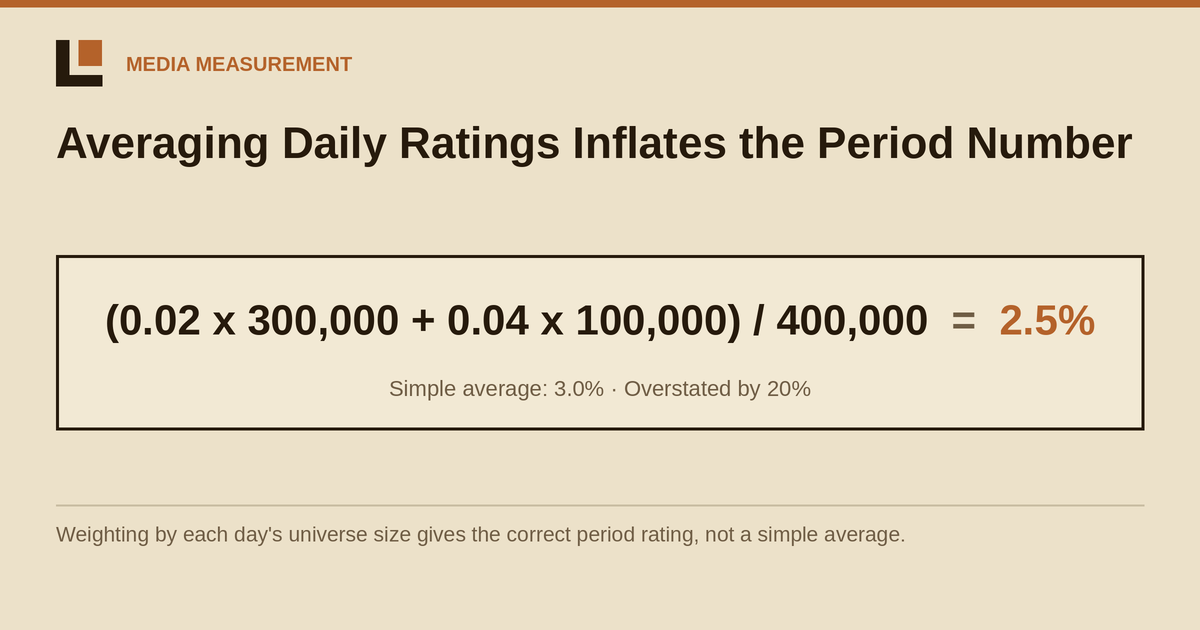
Simplest case. Day one: a rating of 2.0% against a universe of 300,000 people. Day two: 4.0% against 100,000. The arithmetic mean says 3.0%.
The universe-weighted figure goes back to people. Sum the numerators — 6,000 and 4,000 viewer-contacts — sum the denominators, divide once at the end. Day two earned its high rating on a base three times smaller, so it should weigh three times less. The arithmetic mean has no way of knowing that; it treats the two days as equals.
| Method | Result | What it assumes |
|---|---|---|
| Average of daily percentages | 3.0% | Every day has the same universe |
| Universe-weighted | 2.5% | Days weigh by the people behind them |
Half a point — 20% added to the rating out of thin air. Across a campaign of several hundred TRPs that is no third-decimal rounding artifact: calculated reach moves, and the plan economics built on it move with it. And the error does not wash out with volume. It accumulates, because the bias points one way.
How we handle it
In TV Planner, multi-day aggregation is universe-weighted, full stop: numerators and denominators summed separately, percentages never averaged. There is no "whichever you prefer" toggle. The second method is wrong, and shipping it as an option would just keep an argument alive.
For the same reason we compute reach and frequency at the level of individuals, never by adding ratings up. The market base universe is 2,295,613 people. Reach is a property of people — the moment you start summing ratings, duplicates stop being tracked.
None of this was checked by eye. We reproduced the official audience table cell by cell: all 21,548 non-zero cells out of 60,858 matched to within 0.5 of a person, across 17 of 17 demographic breaks. That is the standard we hold ourselves to — every cell matches the reference export, or the work isn't finished. Nielsen publishes the methodology behind those panel universes and their weighting; we reproduce Nielsen's numbers, we do not re-invent them.
What changes in practice
The thing that actually breaks here is a conversation. Two sides bring different figures for the same period to the same meeting, then spend half a day establishing whose export is "correct" — when both exports are identical and only the aggregation method differs. In tool-driven markets, "how does the system aggregate a period?" is a standard line item when choosing software, alongside the definitions bodies like the Media Rating Council set out for audience metrics.
Period aggregation looks like plumbing buried in an engine, and it decides whether two parties can agree on a number at all. Ask about it once, while you are choosing the tool. Not on the morning you defend the plan to a client.
FAQ
Why can't you average daily ratings to get a period rating?
Because each daily rating has a different denominator. Averaging the percentages gives every day equal weight regardless of how many people its universe contained.
How do you calculate a period rating correctly?
Sum the numerators and the denominators separately, then divide. For 2.0% on 300,000 and 4.0% on 100,000: (6,000 + 4,000) / 400,000 = 2.5%.
When does the difference actually matter?
On narrow targets. A small universe swings noticeably day to day, so equal weighting distorts the result — in the example above, by 0.5 points, or 20% of the correct figure.
Does the error cancel out over a long campaign?
No. The bias has a direction, so it accumulates with volume rather than averaging away.
Universe-weighted period aggregation and individual-level reach are how TV Planner reads raw panel data — the same method, every target, no toggle.
Request a demo →