Tilsim product

TV Planner

TV audience analytics on Nielsen data.

TV Planner turns the Nielsen feed for the Moldovan market into live campaign analytics: the agency builds its own reports in the browser, and the client sees the results in a portal of their own.

Live Already
in production

Verified against the Nielsen reporting agencies already use

The metric formulas are checked line by line against the Nielsen desktop tooling in daily use, and parity checks run automatically on every release — a change that would move a rating, a reach figure or a programme number is caught before it reaches a report.

planner.tilsim.app · Dashboard
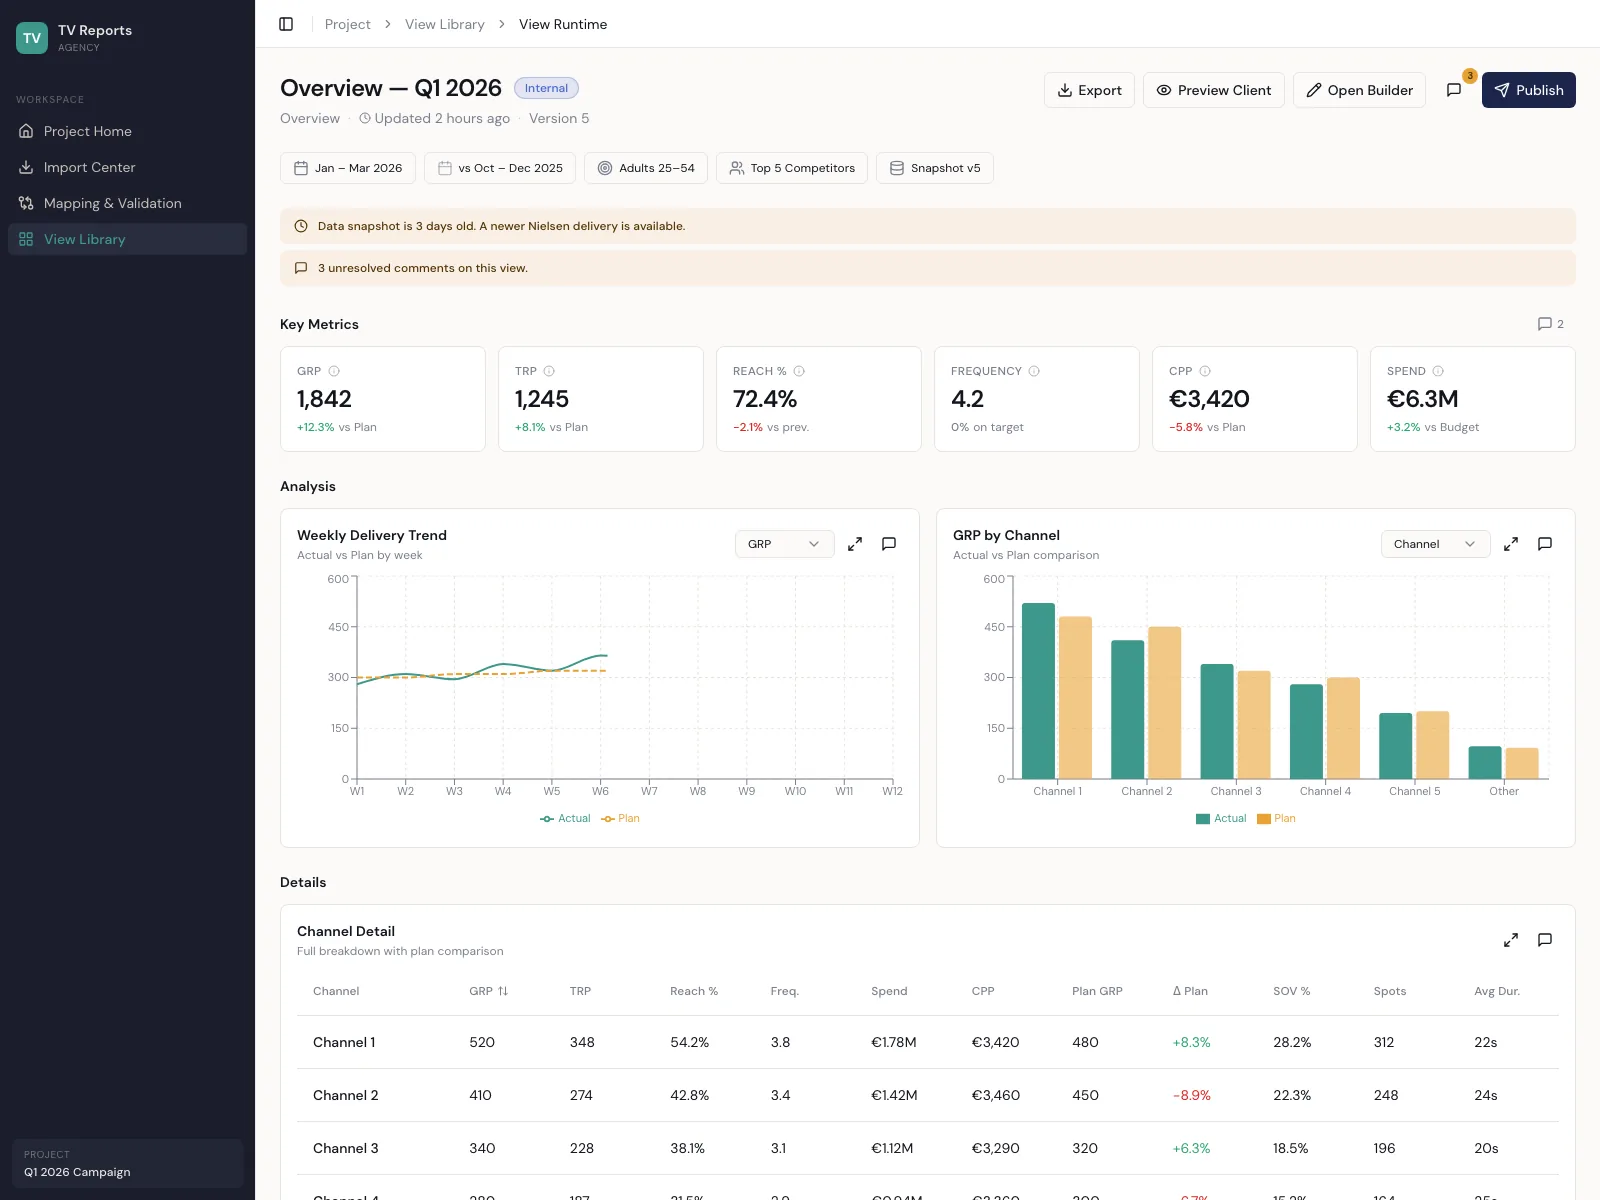
TV Planner dashboard with campaign KPIs, delivery trend and channel breakdown
Live campaign dashboard: GRP, TRP, Reach, Frequency and delivery trend with a channel breakdown.
planner.tilsim.app · Client portal
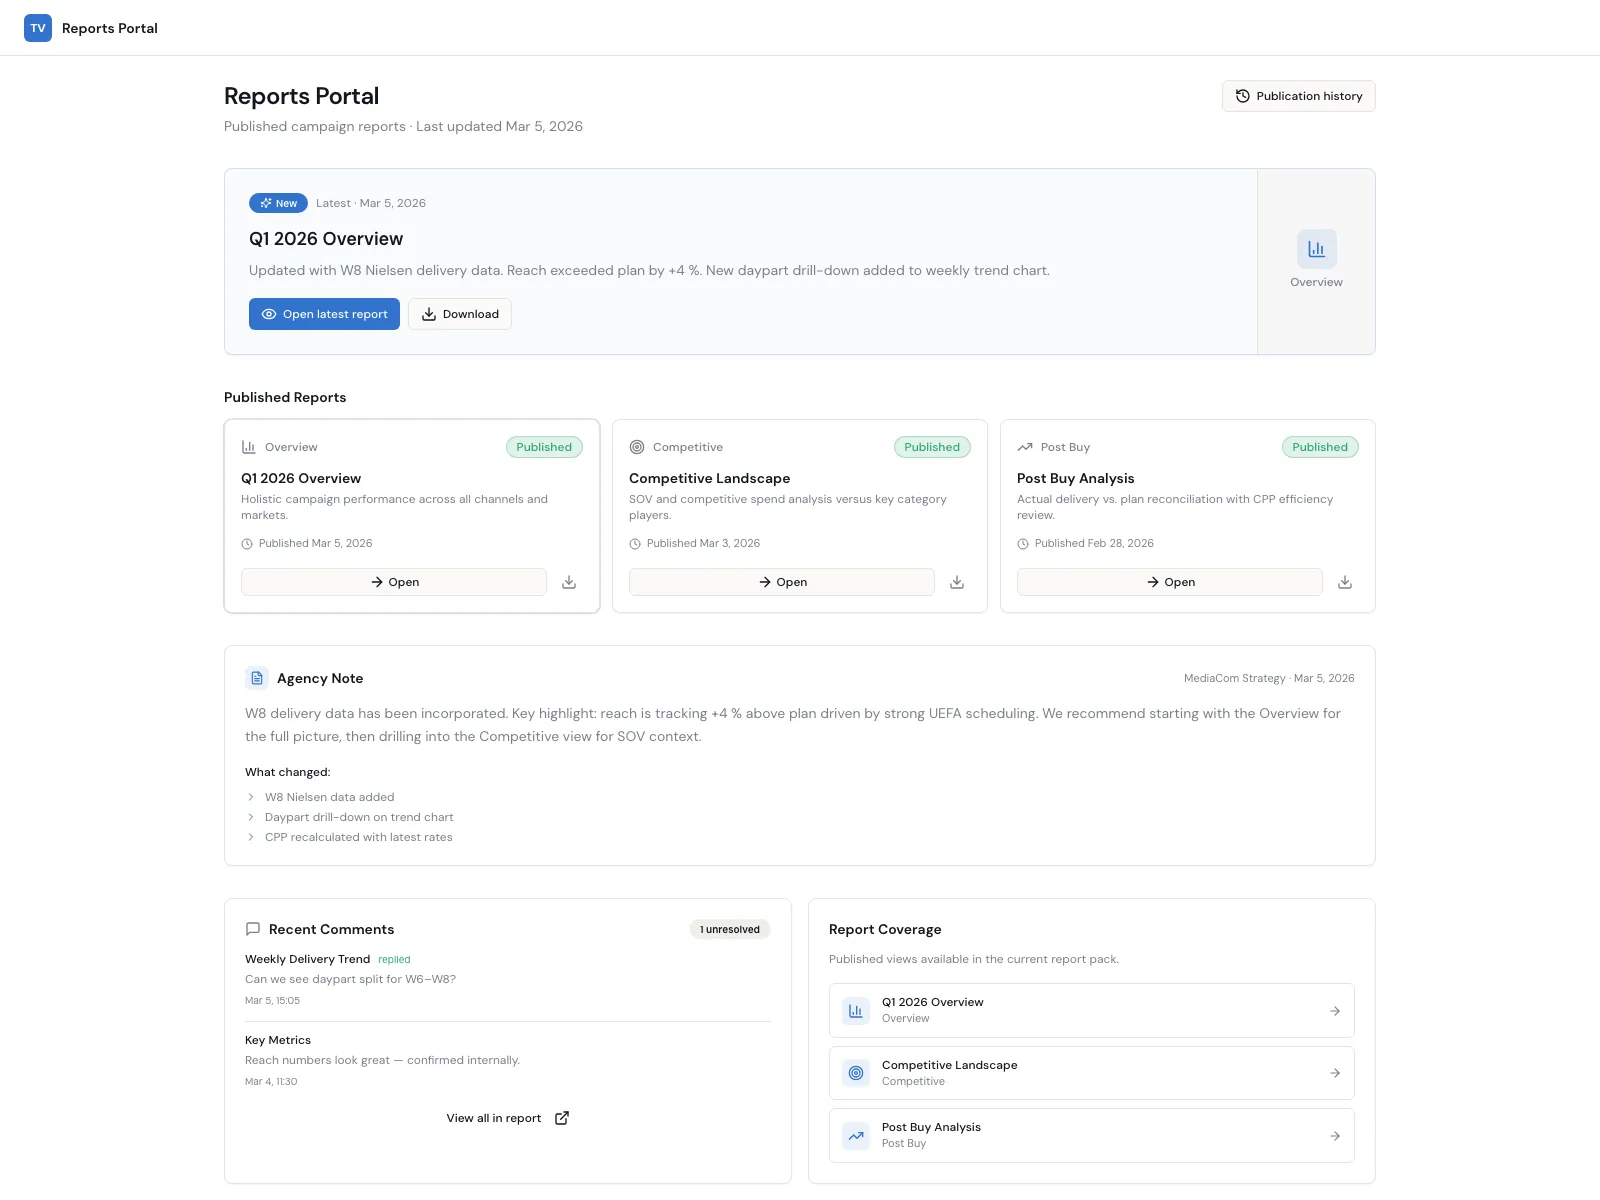
TV Planner client portal with published campaign reports, versions and agency notes
Client portal: published campaign reports for the client, versions and agency notes.

What TV Planner does

Two data worlds in one place: what actually aired, and what people actually watched — recomputed for the audience you sell against.

Spot monitoring

Every airing from the Nielsen SPOT feed becomes a queryable fact: ratings and spot counts, channel and advertiser rankings, share of voice, trends, daypart cuts and break position. Your campaign and the competitive pressure around it sit in the same table.

TV-viewing landscape

People-meter viewing joined to the broadcast schedule: average minute rating and share of viewing, reach and frequency, top programmes, genre structure and the channel-by-daypart heatmap — the picture of the market your campaign lands in.

Target audiences

Build an audience from age, gender, geography, language and education, save it, and the whole report recomputes on it — dashboards, reach and frequency, exports. And the report says plainly whether the audience was applied in full, in part, or not at all.

No-code dashboard builder

Assemble a report from widgets — KPI tiles, charts, tables, rankings, heatmaps — and shape a pivot by dragging rows, columns and values. Versions are kept, and a new layout can be compared with the published one before it goes out. No code, no ticket to the developer.

Client portal: plan and actual

The agency publishes a report; the client opens it through their own link and sees the campaign plan against what was actually delivered, by channel and week, with the deviations called out. Comments stay next to the numbers they are about. The plan side of that comparison is costed in duration-weighted TRP — the same arithmetic the wTRP → budget calculator runs in the browser.

Free tool·wTRP ↔ budget, both directions

Computed metrics GRP wGRP TRP AMR% Share of viewing Share of voice Reach & Frequency (N+) Average time spent Delivery vs plan

How it works

One path from the raw Nielsen feed to the report your client opens — with the same number at every stop.

Nielsen data lands in the database

Spot monitoring, people-meter viewing and the broadcast schedule are ingested into PostgreSQL. Channel, advertiser and brand references are checked in the import centre against the system dictionaries — mapping and validation happen before anything is counted, not after someone spots a strange number.

Metrics are computed in the database

All TV maths runs as SQL inside PostgreSQL, so the database stays the single source of truth. There is no spreadsheet layer and no quiet re-aggregation in the browser: the same request returns the same number, today and next quarter.

The analyst sets the context

Period, target audience and channels are chosen once on the dashboard, and that choice wins over whatever was saved inside an individual widget. A report cannot silently show two different periods in two neighbouring tiles.

The report is assembled from widgets

Start from a template or an empty canvas, drop in KPI tiles, charts, tables, rankings and heatmaps, and bind each of them to real data through the endpoint catalogue. Save a version, compare it with what is currently published, then publish.

Publishing freezes a snapshot for the client

On publish, every widget is computed once and frozen into a snapshot. The client opens that snapshot through a revocable link: real numbers, an honest age indicator, room to comment — and no access whatsoever to the live analytical engine behind it.

Working with Nielsen data

Nielsen is the measurement source for the Moldovan TV market and the data partner this product is built around. TV Planner reads Nielsen exports and reproduces Nielsen figures: the metric formulas are verified against the Nielsen desktop reporting the agency already uses, and parity checks run automatically on every release, so a change that would move a number is caught before it reaches a report.

Tilsim is a user of Nielsen data and a partner, not a certification holder. TV Planner is Tilsim's own software and is neither certified nor endorsed by Nielsen; all trademarks belong to their owners. What those parity checks cover, and where their limits are, is set out in the Tilsim methodology.

Methodology·How the numbers are verified

Questions we get asked

What data does TV Planner run on?

Nielsen data for the Moldovan TV market: spot monitoring (which commercial aired, on which channel, when and in which break), people-meter viewing at member level, and the broadcast schedule with programmes and genres. All of it is loaded into a PostgreSQL database, where the metrics are computed.

Is TV Planner a Nielsen product?

No. Nielsen is the data source and the partner; TV Planner is Tilsim's own web application that reads Nielsen exports and reproduces Nielsen figures. It is not certified or endorsed by Nielsen.

How do you know the numbers are right?

Because they are checked against the reporting the agency already trusts. Metric formulas are verified line by line against the Nielsen desktop tooling in daily use, and those comparisons run as permanent automated gates — a release that would shift a rating, a reach figure or a programme number does not ship quietly.

What exactly does the client see?

A published snapshot: the numbers frozen at the moment of publication, opened through a revocable link, with the plan against the actual delivery and the agency's notes. Clients can leave comments, and they never touch the live system or anyone else's report.

What is needed to start using it?

A browser. TV Planner is already in production and installs nothing on the analyst's machine; agency access is by invitation (password or Google sign-in), and the client only needs the link you send them.

See it on your own campaign

The fastest way to judge TV Planner is on a campaign you already know the answer to. We will walk through the data, the builder and the client view — and tell you plainly what the product does not do yet.