Tilsim product

TV Budgeting

TV budgeting & media planning software for agencies and advertisers.

It turns a rating target into a budget a buyer can defend — and a budget back into the ratings it actually buys — running both directions through the same calculation core.

<0.01% Deviation from
the reference model

Accuracy means reproducibility, not a nicer chart

Measured against an agency's reference Excel model, the calculation reproduces the result with under 0.01% deviation. The maths core is frozen and held in place by an automated parity suite that reconciles the output against the reference workbooks cell by cell — when a scenario fails, the cause gets fixed, the tolerance never gets loosened. The same discipline is written out product by product in the Tilsim methodology, including what the parity suite covers and what it does not.

Methodology·How the numbers are verified

What it does

The whole market mechanic, not a slice of it: rate cards, seasonality, dayparts and negotiated discounts all live inside one chain — and the chain runs in both directions. The category view of that chain — the seven calculations any media planning software has to get right — sets the bar this product is built against.

Category·What planning software must compute

Both directions, one core

“How much will the required volume of advertising cost?” and “how much advertising will the allocated budget buy?” are the same question read from opposite ends. The reverse path is not separate maths — it is the same chain run backwards, on the same frozen formulas.

TRP → budget · budget → TRP

Channel rate cards (CPP)

Every channel carries its own base cost per rating point for a 30-second spot. That base is never used raw: it passes through an ordered chain of coefficients, and the order is part of the result.

CPP = base × (1 + seasonality) × (1 − combined discount) × (1 + uplift)

Seasonality

Each channel gets a monthly curve on top of its base rate: December air is dearer, January cheaper. The coefficient is a market input applied per month — not an average smeared across the year, and not a hidden constant.

Prime and off-prime

Off-prime is negotiated as a share of money, but it delivers a different share of ratings — cheaper inventory buys more points per euro. The conversion uses the off-prime discount and each daypart's affinity, so the two units never get confused.

money share in → rating share out

Seller discount ladders

Monthly ladders keyed to the average monthly channel budget, contract ladders keyed to the annual seller or channel volume, plus manual extra rates. They compose the way contracts actually work — sequentially, on what remains.

20% then 10% = 28%, not 30%

Iteration until stable

The discount tier depends on the budget, and the budget depends on the discount. The solver loops — price it, pick the tier, reprice, pick again — until the discount picture stops moving. If a budget sits on a threshold and oscillates between two tiers, it takes the larger budget: the conservative number a buyer can defend.

Also in the chain

Duration weighting. A shorter spot costs less and weighs less. Raw TRP becomes weighted TRP against a 30-second reference before any money is calculated.

Also in the chain

Affinity. TRP is measured in the brand's target group, GRP across everyone. Affinity bridges them per channel, per month, per daypart.

Also in the chain

Shop List and Execution. The volume declared to the seller sets the tier; the money that actually runs is tracked separately, so a flight change never silently rewrites the terms it earned.


On CPP and money. CPP here works as a planning proxy: it behaves like price inside the model and reproduces the agency's budgeting arithmetic, but it is not a feed of contracted rates. It cannot establish real spend, savings or ROI — and this product does not claim to. For the full seven-step breakdown of the chain, read the guide: Media planning software: what it actually computes → A stripped-down version of the same arithmetic — one CPP, one seasonal index, one ladder — runs in the browser as the wTRP → budget calculator, if you want to check the shape of the answer before booking a demo.

Free tool·wTRP ↔ budget, both directions

In the app

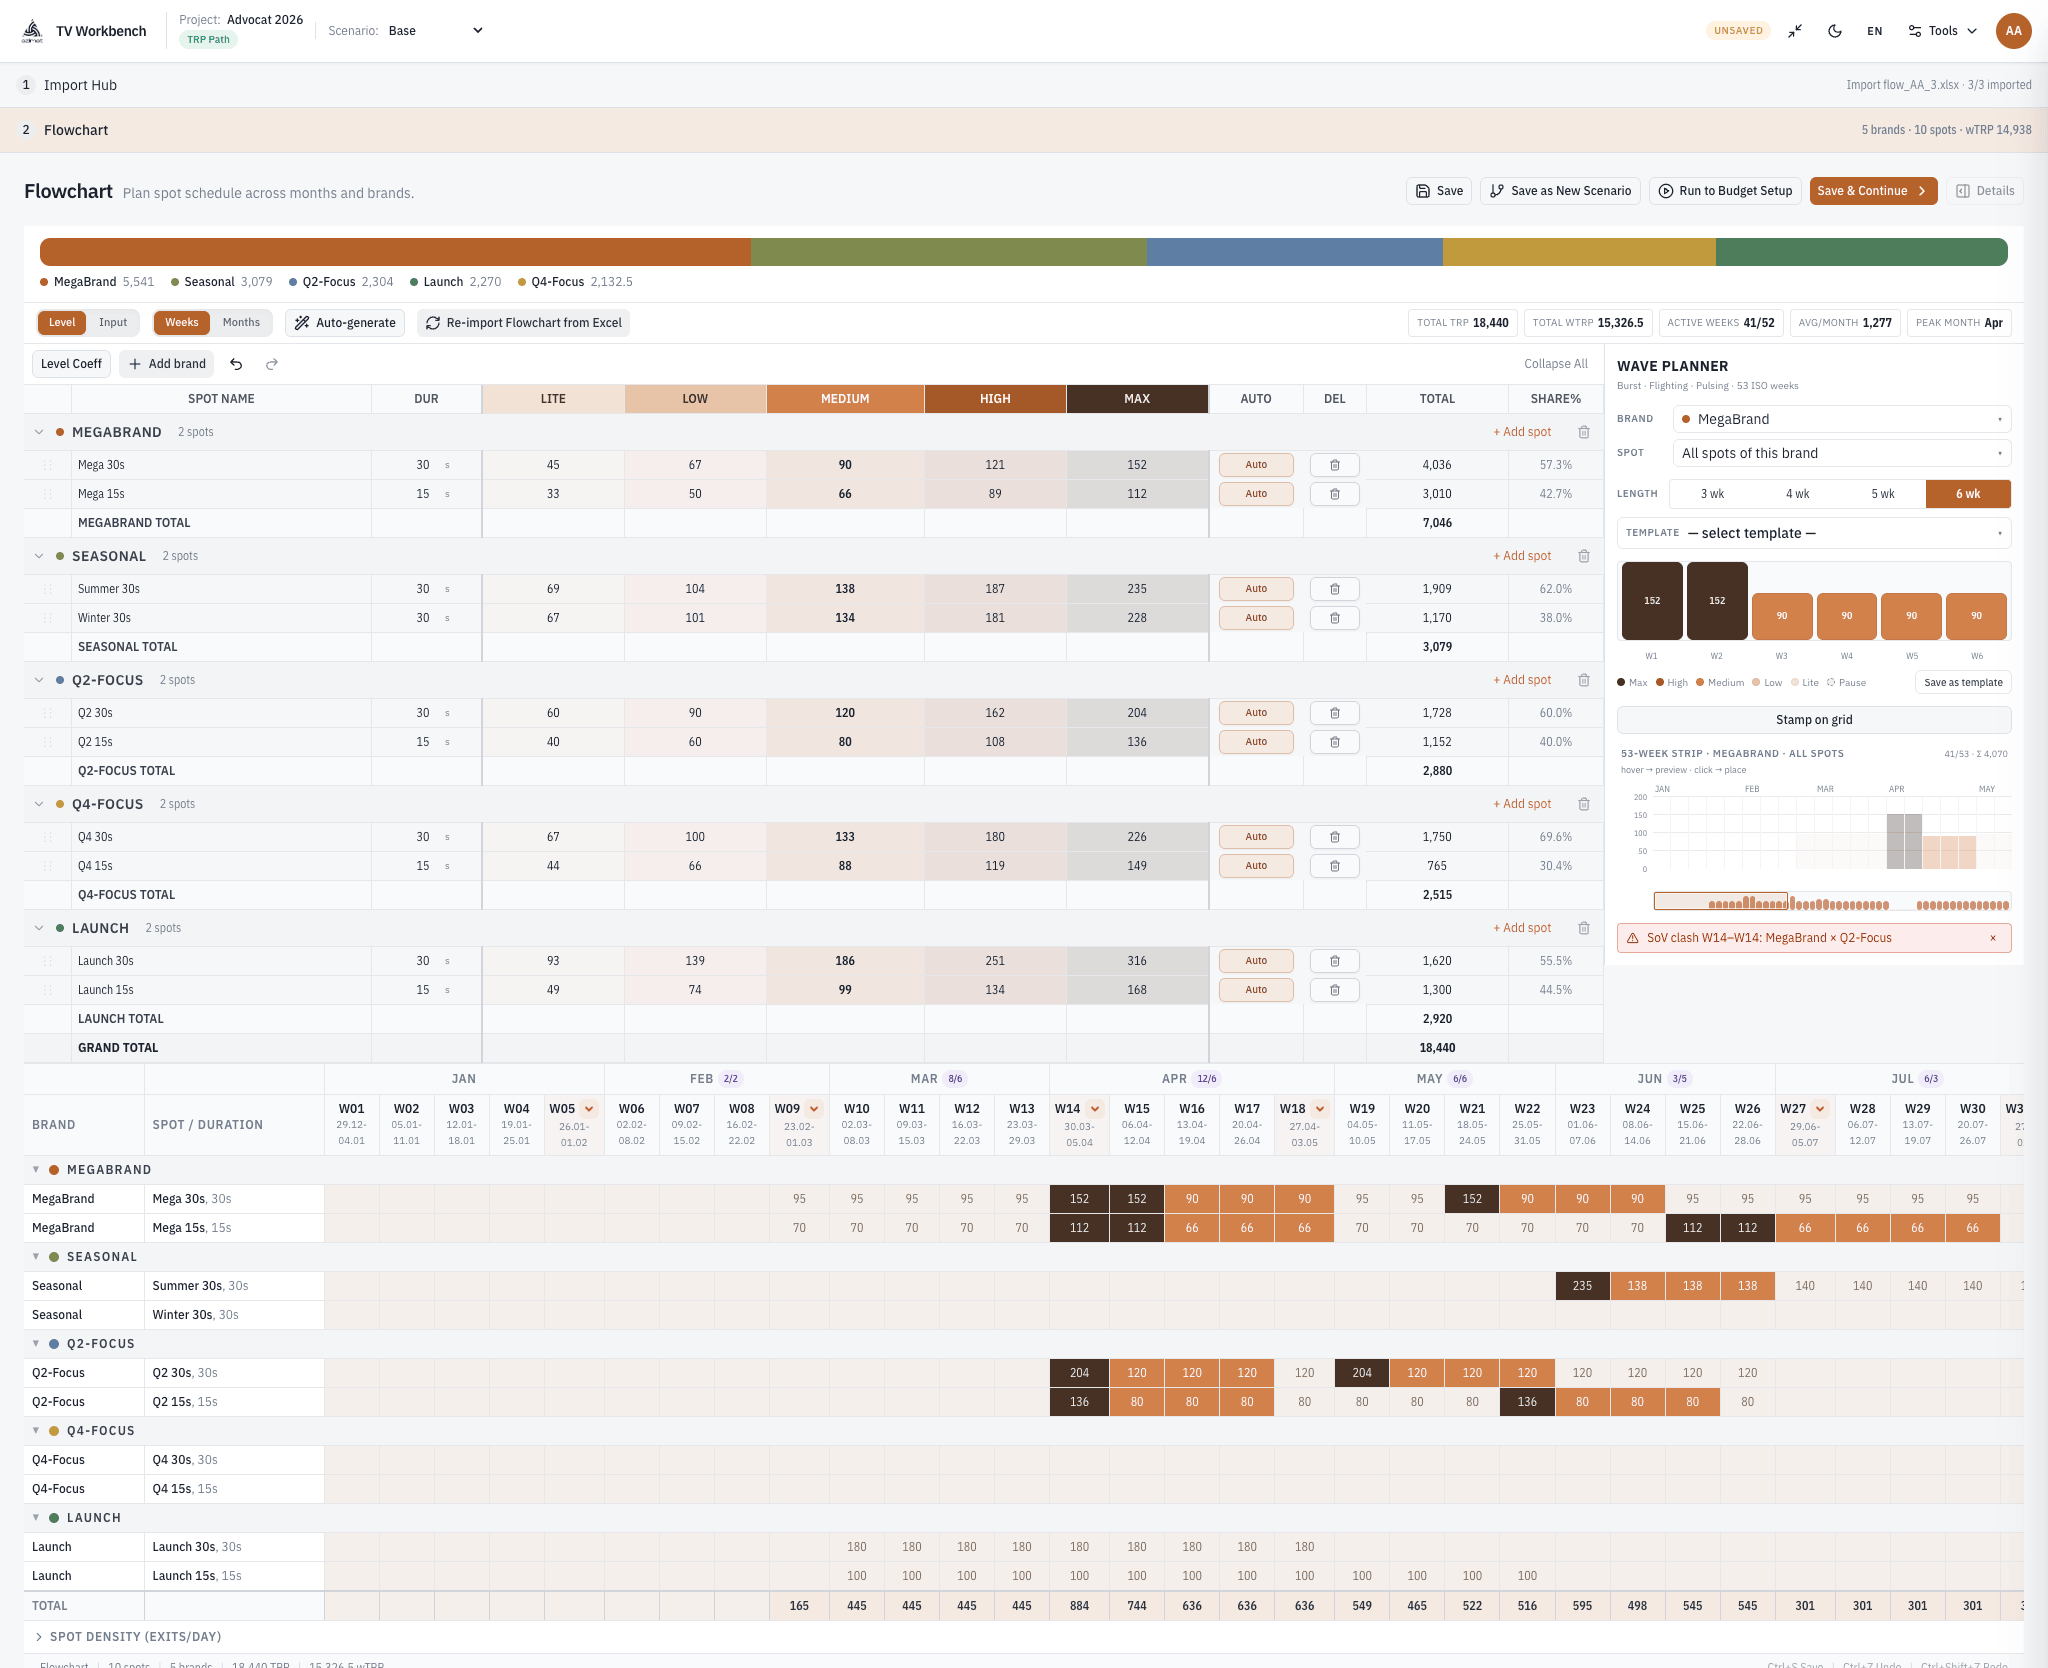
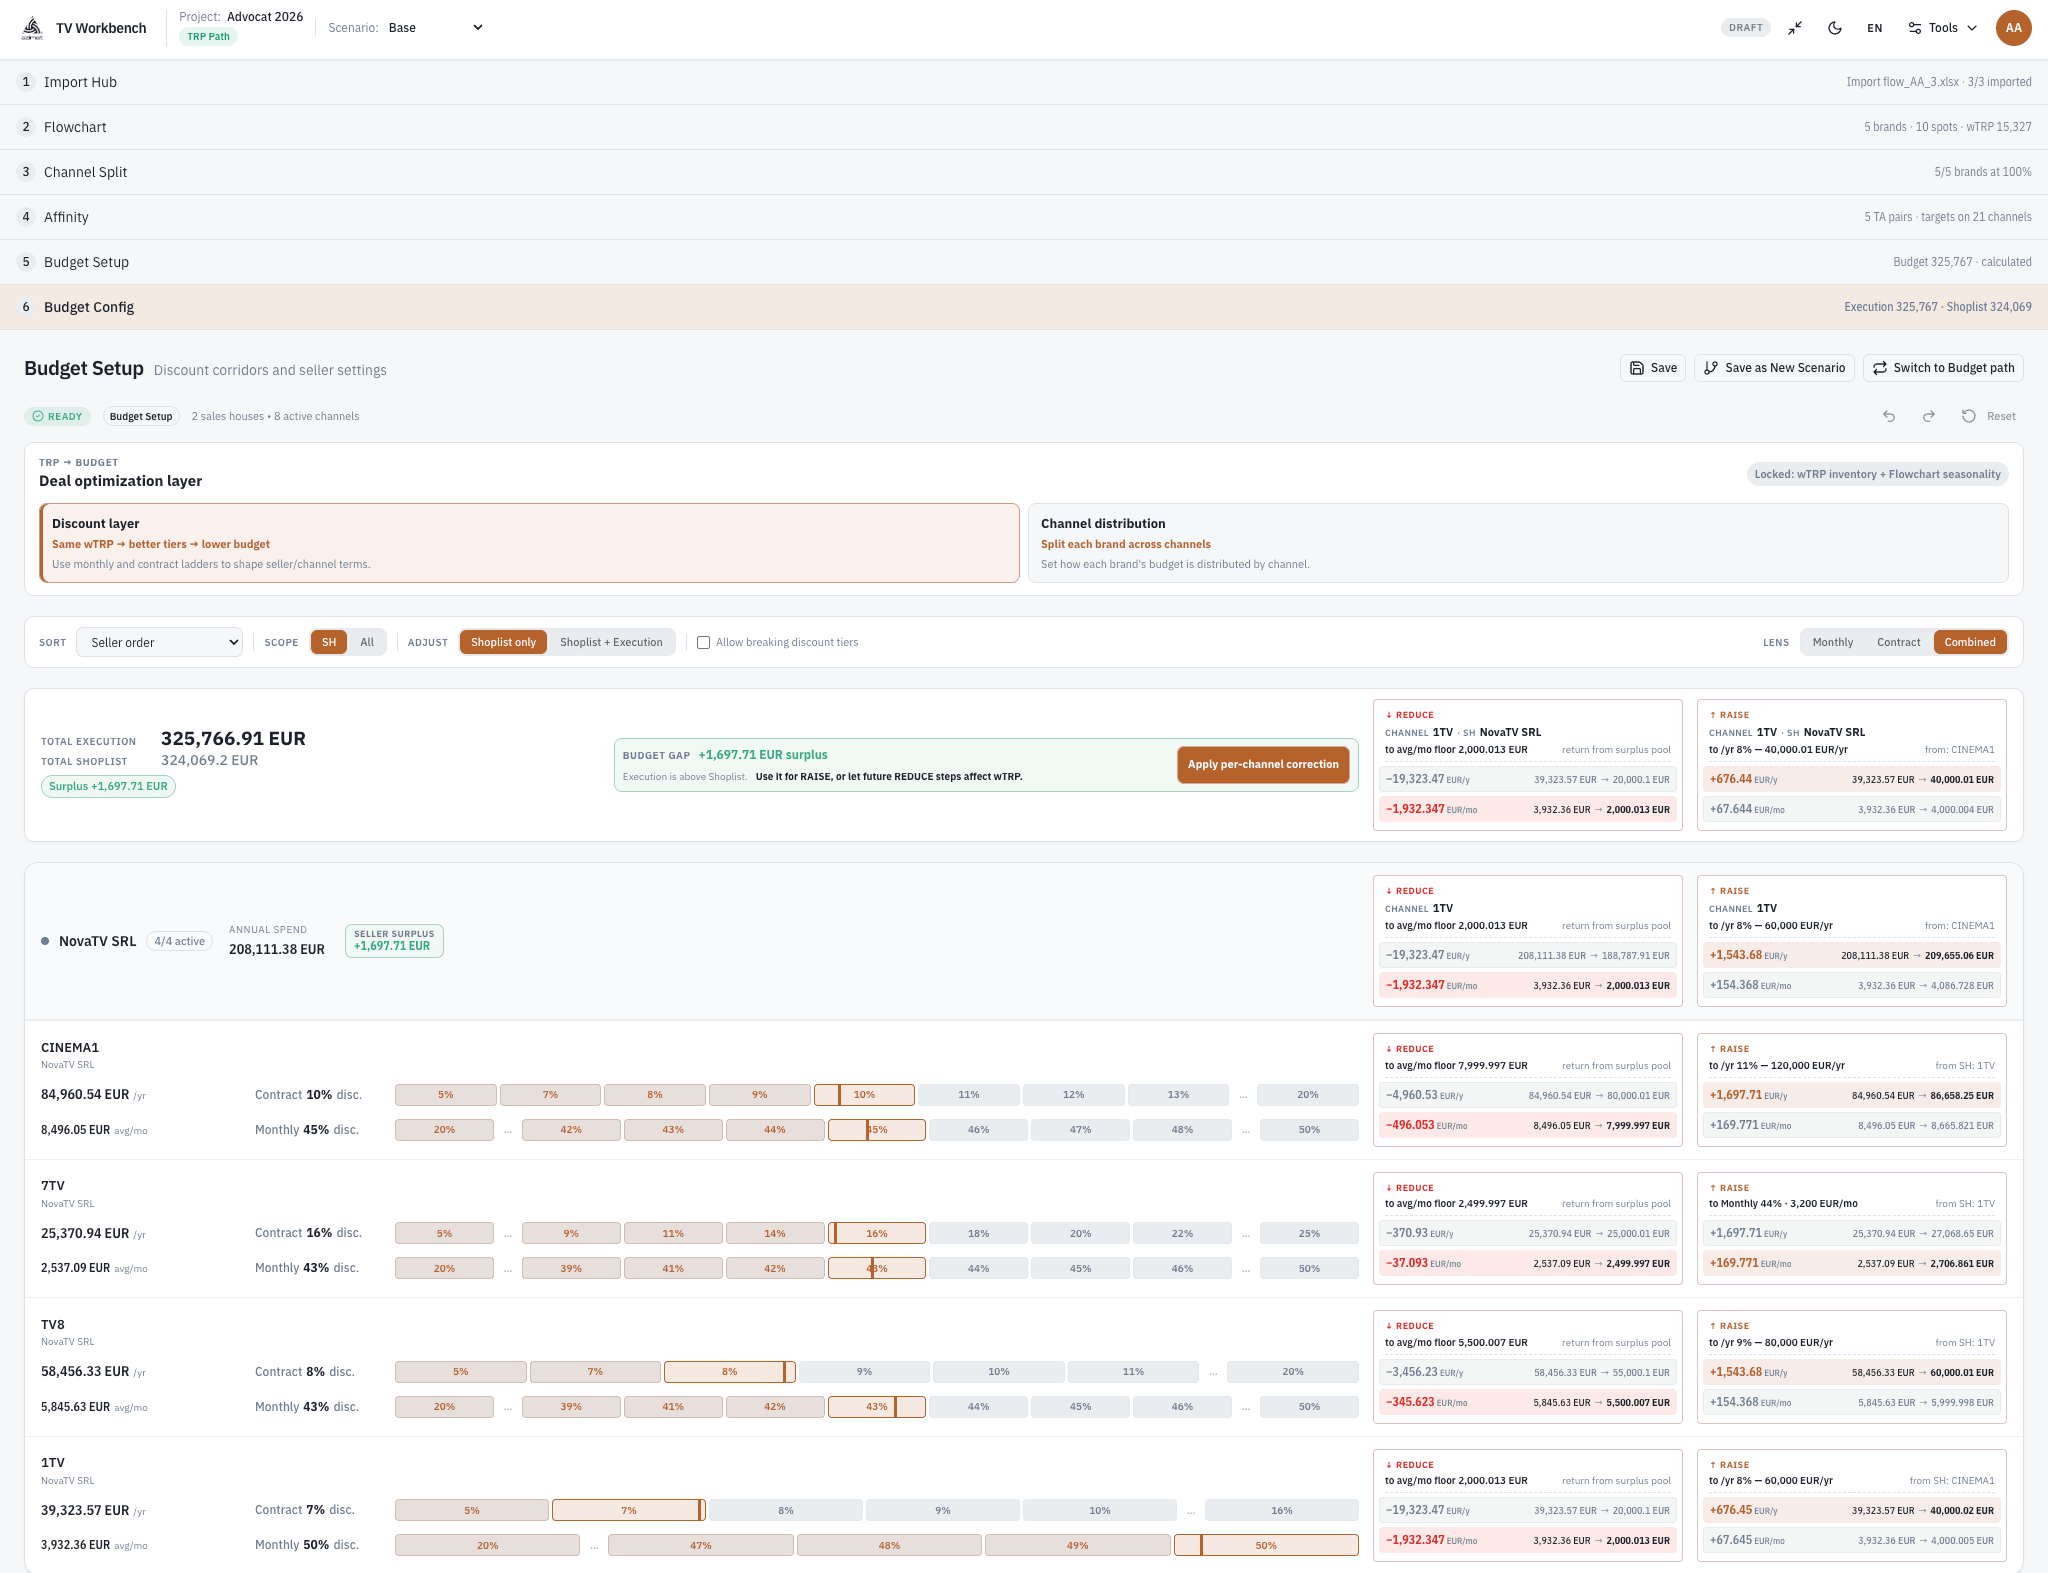
Two of the screens a media buyer spends the most time on: laying out the flight, and settling the commercial terms.

tv.tilsim.app · Flowchart
TV Budgeting — Flowchart screen: campaign flight laid out across the weeks of the year by spot and channel
Flowchart: the flight across the weeks of the year, spot by spot, with the campaign timeline in colour.
tv.tilsim.app · Budget Setup
TV Budgeting — Budget Setup screen: seller terms, final budget and allocation across sales houses
Budget Setup: seller conditions, the resulting budget and its allocation across sales houses.

How it works

A campaign moves through the same named screens every time, and each one is confirmed before the next opens. Nothing is carried forward on an assumption.

Set up the project

Projects

Choose the advertiser, the period and the market price list, then fix the direction: start from the money you have, or from the rating volume you need. The direction belongs to the project — it decides what every numeric cell downstream means.

Lay out the flight

Flowchart

Spread the campaign across the weeks of the year, spot by spot and brand by brand, with spot durations attached. Depending on the direction chosen, the cells hold either rating points or money — the grid is the same, the unit is not.

Split across channels

Channel Split

Pick the channels for each brand and set their shares. The shares must total exactly 100% — the calculation stays blocked until they do, and nothing is silently normalised on your behalf.

Attach audiences and affinity

Affinity

Assign the buying and target audiences, then load the affinity and average-minute-rating figures — from your own imported data, or pulled from the market's audience panel. Both sources stay visible, so you always know which one the plan is standing on.

Settle the terms and solve

Budget Setup · Budget Config

Enter the commercial terms per seller — off-prime share, off-prime discount, uplift, extra rates — and run the calculation. The solver reconciles the budget with the discount ladders and reports whether it converged.

From there you can raise or reduce the plan and watch which channels absorb the change, with a warning when a move would break a discount tier. Alternatives are saved as separate scenarios and compared side by side, so the confirmed plan is never overwritten to test an idea.

Questions buyers ask

Does it really calculate in both directions?

Yes, and on the same formulas. Budget to TRP is not a second engine with its own assumptions — it is the same chain traversed backwards, so a plan costed one way reconciles when you check it the other way. The direction is chosen when the project is created, and switching means branching into a new scenario rather than quietly rewriting the confirmed one.

Why do seller discounts multiply instead of adding up?

Because each discount applies to what is left after the previous one. A 20% discount followed by a 10% discount leaves 0.80 × 0.90 = 0.72 of the base, so the combined discount is 28%, not 30%. Adding them looks generous on a slide and produces a budget the seller will not sign. The rest of the deal-side arithmetic — budget-dependent tiers, CPP baselines, prime/off-prime money shares — is laid out under media buying software.

Category·The deal maths, end to end

Is the prime/off-prime split entered as money or as ratings?

As money — that is how it is negotiated. The engine then converts it into a share of ratings using the off-prime discount and the affinity of each daypart, because cheaper inventory delivers more points per euro. Treating the money share and the rating share as the same number models a deal you did not agree to.

What happens when a budget lands right on a discount threshold?

The loop can oscillate: applying the higher tier drops the budget back below its own threshold, and dropping the tier pushes it above again. The solver needs an explicit rule for that boundary, and it takes the larger budget — the conservative side for the buyer, reserving what can be defended rather than presenting the flattering figure.

Can it show real prices, savings or ROI?

No, and it does not claim to. The rate cards behave like price for planning purposes, but they are a planning proxy, not a feed of contracted rates. The product reproduces the budgeting arithmetic an agency already does by hand — it does not measure what was actually spent, saved or returned.

How this is calculated

The arithmetic behind the product, explained step by step.

The terms behind it

Bring a plan you have already reconciled

The most useful demo is a line-by-line comparison, not a tour of screens: take a campaign you have already costed by hand and run it through both directions. Every gap should resolve to a named coefficient.